
A Leader in Patient-Centered Healthcare Tackles Physician Data Overload
In the fast-changing landscape of modern healthcare, primary care physicians (PCPs) are grappling with a rising tide of data points. As the first point of contact for patients and thus the guardians of their overall wellbeing, PCPs bear the tremendous responsibility of managing diverse medical conditions and making critical patient care decisions—all while staying abreast of the latest research and guidelines.
In addition to an avalanche of research papers and medical literature, PCPs have access to troves of information on their patients—from data points on emergency department (ED) utilization to information about the most prevalent diseases treated and the total number of screenings ordered. At best, the volume of data provided can be overwhelming for physicians. At worst, it can challenge their ability to uphold patient care standards.
We partnered with Belong Health, a health plan provider in the United States, to address this challenge. Together with Belong, we honed in on a critical source of data overload for physicians: monthly data summary reports provided by a third party. These reports aim to change physicians’ behavior by giving information on patient health and highlighting opportunities to improve their practice. This is good in theory—but reports rarely make a dent on physician behavior. Why?
A glance at the ‘industry standard’ report below reveals that these reports are typically characterized by multiple pages (5+), lots of numbers in tables, and a sea of information.
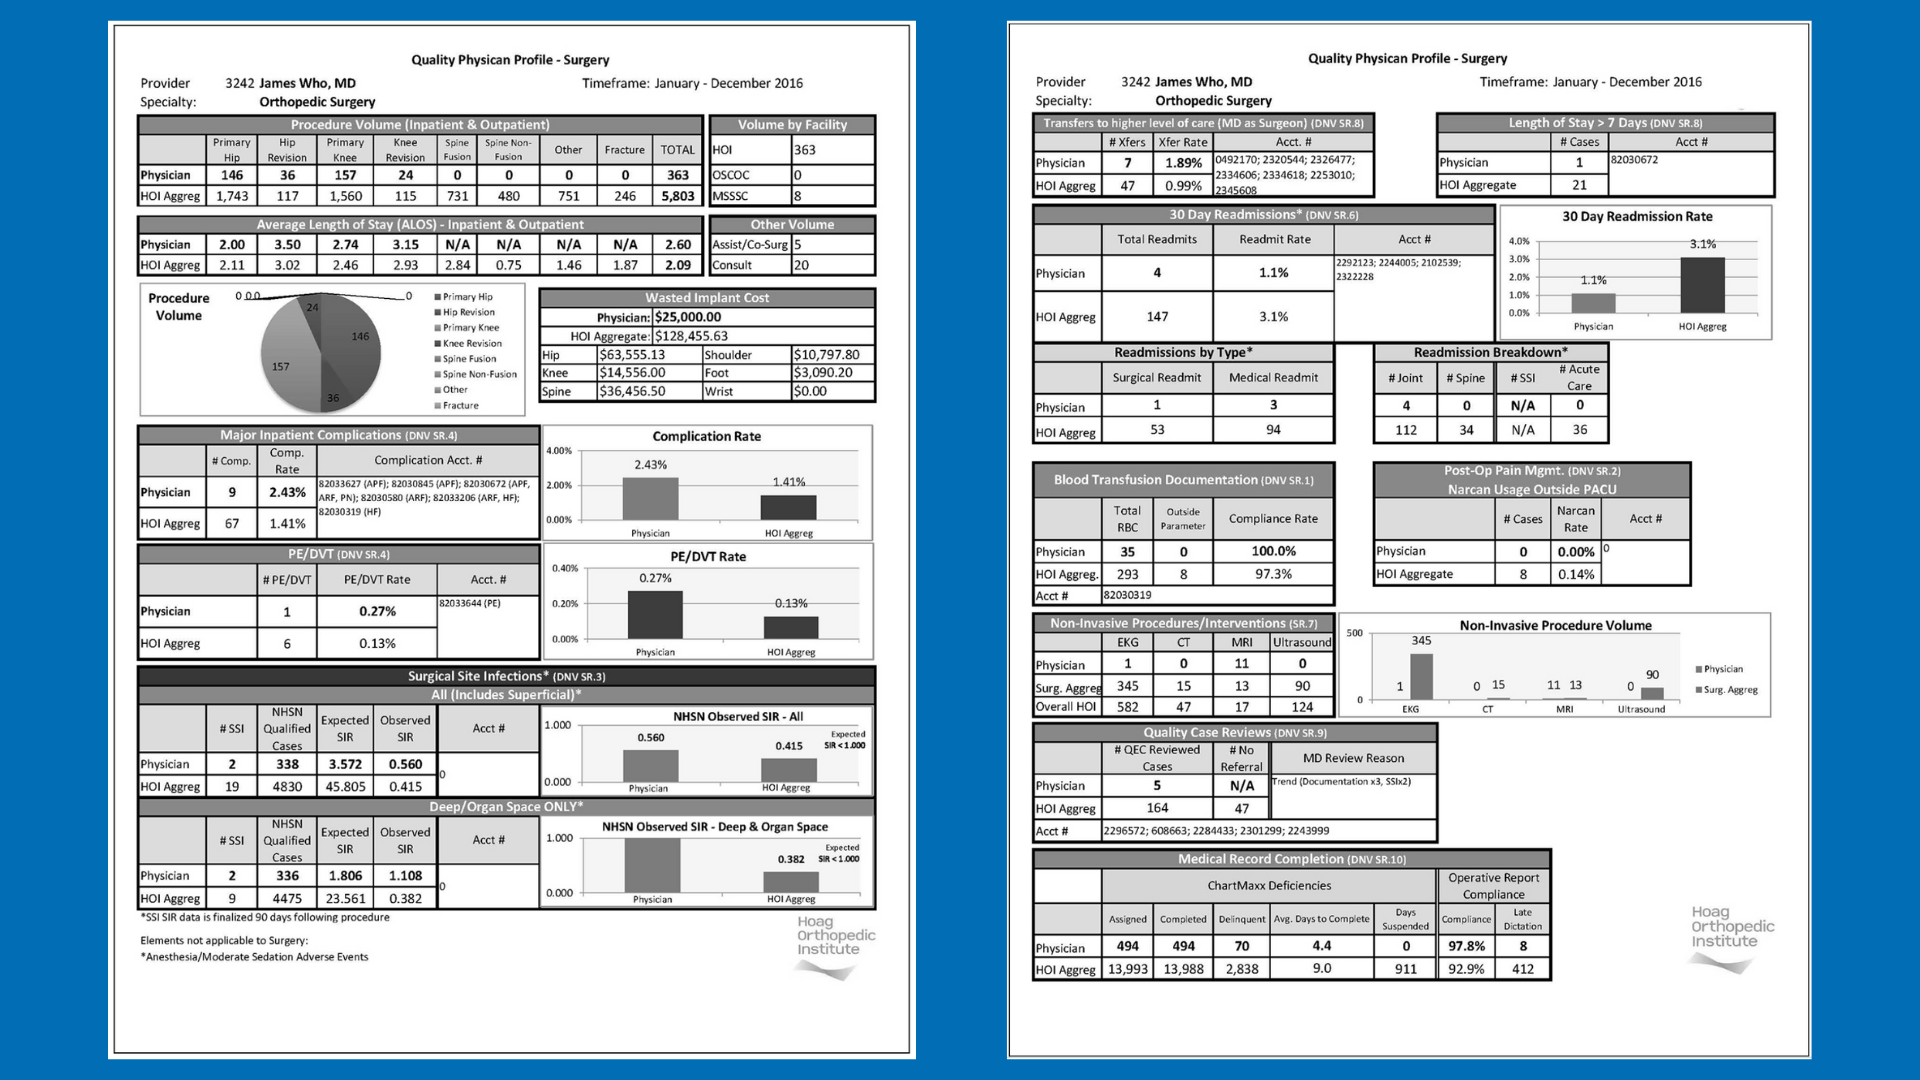
As a result, this novel idea to help physicians gain data to improve their patient health and practice performance becomes a complex series of pages that is rarely opened and difficult to act upon.
Belong knew something needed to change. As a leader in advancing patient-centered care and reducing costs, they set out to make these reports more useful for providers and more impactful for patients—and partnered with Irrational Labs to make it happen.
The Challenge: How to Increase the Usefulness and Impact of Physician Data Reports?
We applied a behavioral science lens to existing (‘industry standard’) physician data summary reports. From a behavioral science perspective, we determined that most reports have three overarching cognitive barriers that hinder their impact and usability.
Barrier #1: Cognitive Overload
The existing reports default to a ‘more information is better’ approach—however, we found that the volume of information provided leads to decision paralysis. Too much is included, making the reports difficult to digest. Physicians, in particular, operate under extreme time scarcity. With so many competing demands, they experience cognitive depletion that necessitates strategic allocation of mental resources.
Barrier #2: Lack of Relativity
We humans denote the value of services, products, and goods based on similar services, products, and goods that exist in the market. We actually don’t know the ‘true’ value of any given product or service—because that value is heavily influenced by a comparable or the surrounding context. Consequently, when we get numbers and data in isolation, it’s hard for us to interpret them. For example: is a primary practice that spends $3,000 per month spending a little or a lot? Without a comparable, it’s hard to know. Many of the standard physician data reports we examined similarly lacked benchmarks or comparison points—hindering physicians from drawing actionable conclusions.
Barrier #3: Intention-Action Gap
Most physicians already know that they should see their diabetic patients more frequently or do more cancer screenings—but nevertheless don’t follow through. Existing physician data reports do little to bridge this gap. Rather than sharing how physicians could improve their practice, industry standard reports tend simply to contain information on where their screening metrics or visits stand.
A review of these barriers led us to frame our work around the question: How can we redesign these monthly physician data reports to make them more useful for providers—and more impactful for patients?
Our Strategy: Reimagine Physician Data Reports
We worked with Belong to redesign these reports by infusing them with numerous behavioral science insights, including those outlined below. These interventions focused on making the new reports more digestible and actionable, thus laying a foundation for physician behavior change and improved patient health.
Behavioral Science Approach #1: Reducing and Simplifying Information
To combat cognitive overload, we reduced and simplified the information provided in these reports in several ways.
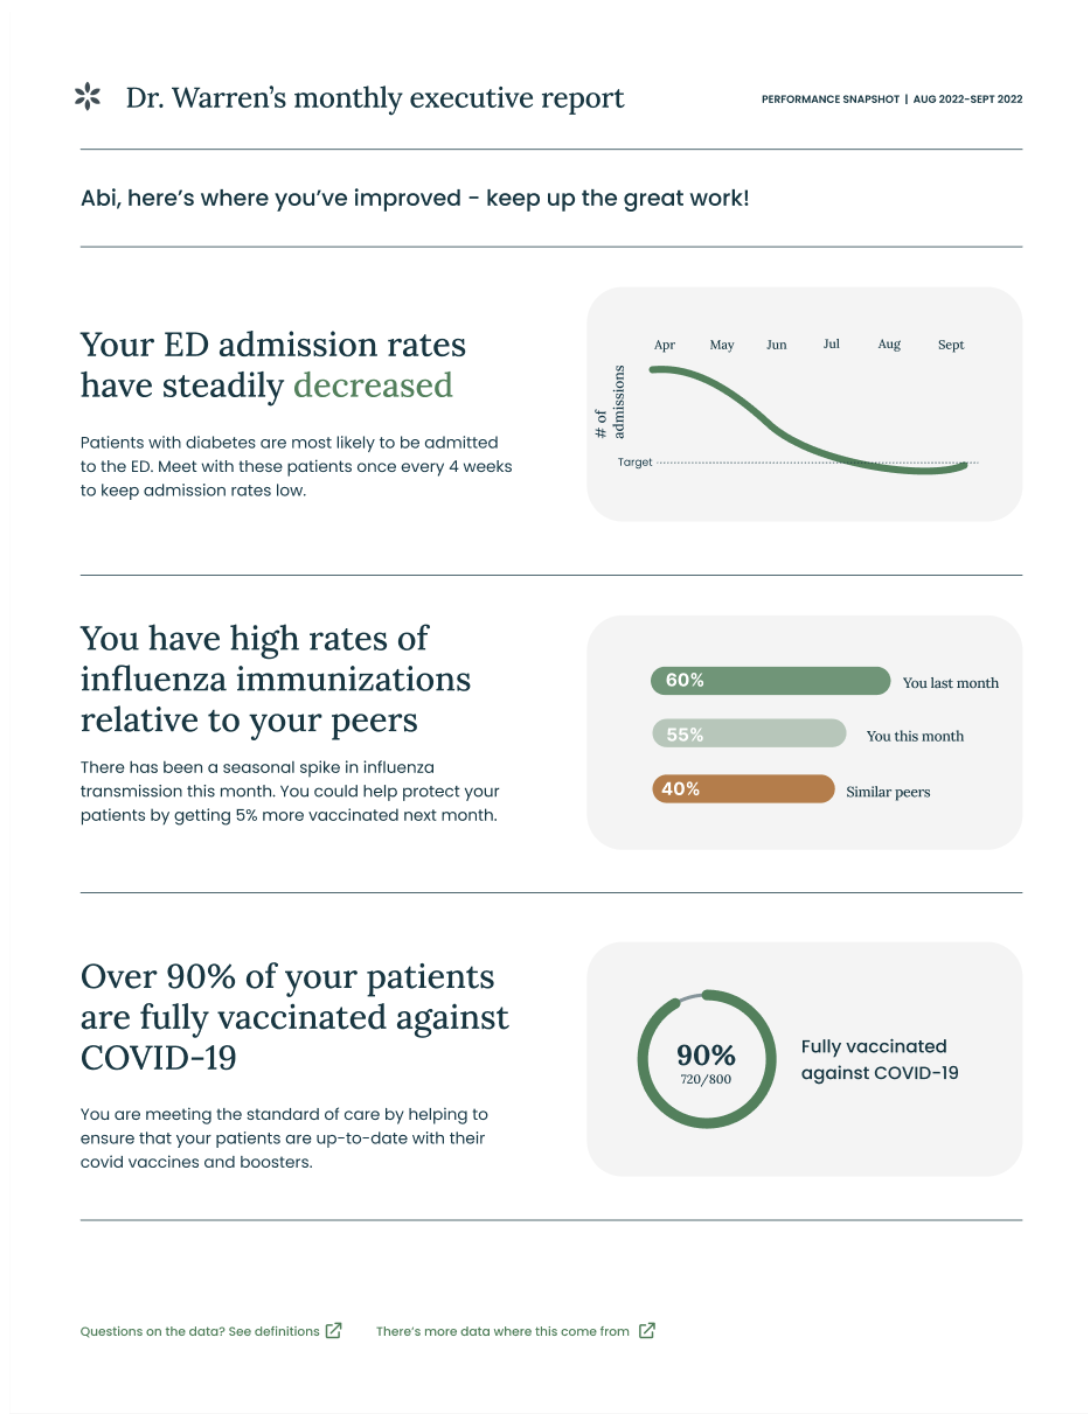
First, we decreased the amount of data presented on each page of the report. Whereas industry standard reports provide the kitchen sink, we worked with Belong to identify and report just the top three metrics for each category. However, we still wanted to showcase Belong’s strong analytics—so we made other information accessible through a linked dashboard. This let providers delve deeper if desired, but still receive an executive summary or ‘snapshot’ of the most crucial insights either way. It also helped enhance trust in the data by offering transparency around how metrics are calculated. Other studies have shown that such transparency increases the perceived value of products, as well as builds trust.
We also leveraged ‘traffic light’ labeling, using a green, yellow, and red color-coding system to signify good, moderate, and problematic areas in the reports. This color scheme aligned with pre-existing color associations, enabling physicians to interpret the data at a glance.
Finally, we shifted from using tables to presenting the data in graphs. Studies have shown that physicians benefit from visual representations of data, and additional research has found that graphs tend to be more easily understood than tables.
Behavioral Science Approach #2: Social Comparisons and Benchmarking
People are intrinsically motivated to compete with their peers—and this is especially true for physicians, who tend to be high achievers at baseline. Various studies have shown that sharing how peers perform on a given task can motivate others to change their behavior. For instance, in a study aimed at reducing opioid prescriptions, researchers provided individualized peer comparison data to ED and urgent care physicians.3 This data showed how many opioid prescriptions each physician made compared to their peers during the same period. The results demonstrated that physicians who received this peer comparison feedback significantly reduced the number of pills per prescription (-0.8 fewer pills per prescription) relative to usual care. Notably, this reduction in prescriptions was comparable to the impact of a more severe intervention, where the county notified physicians of their patients’ fatal overdoses. Needless to say, something as simple as being compared to similar others can be all it takes to change prescribing behaviors.
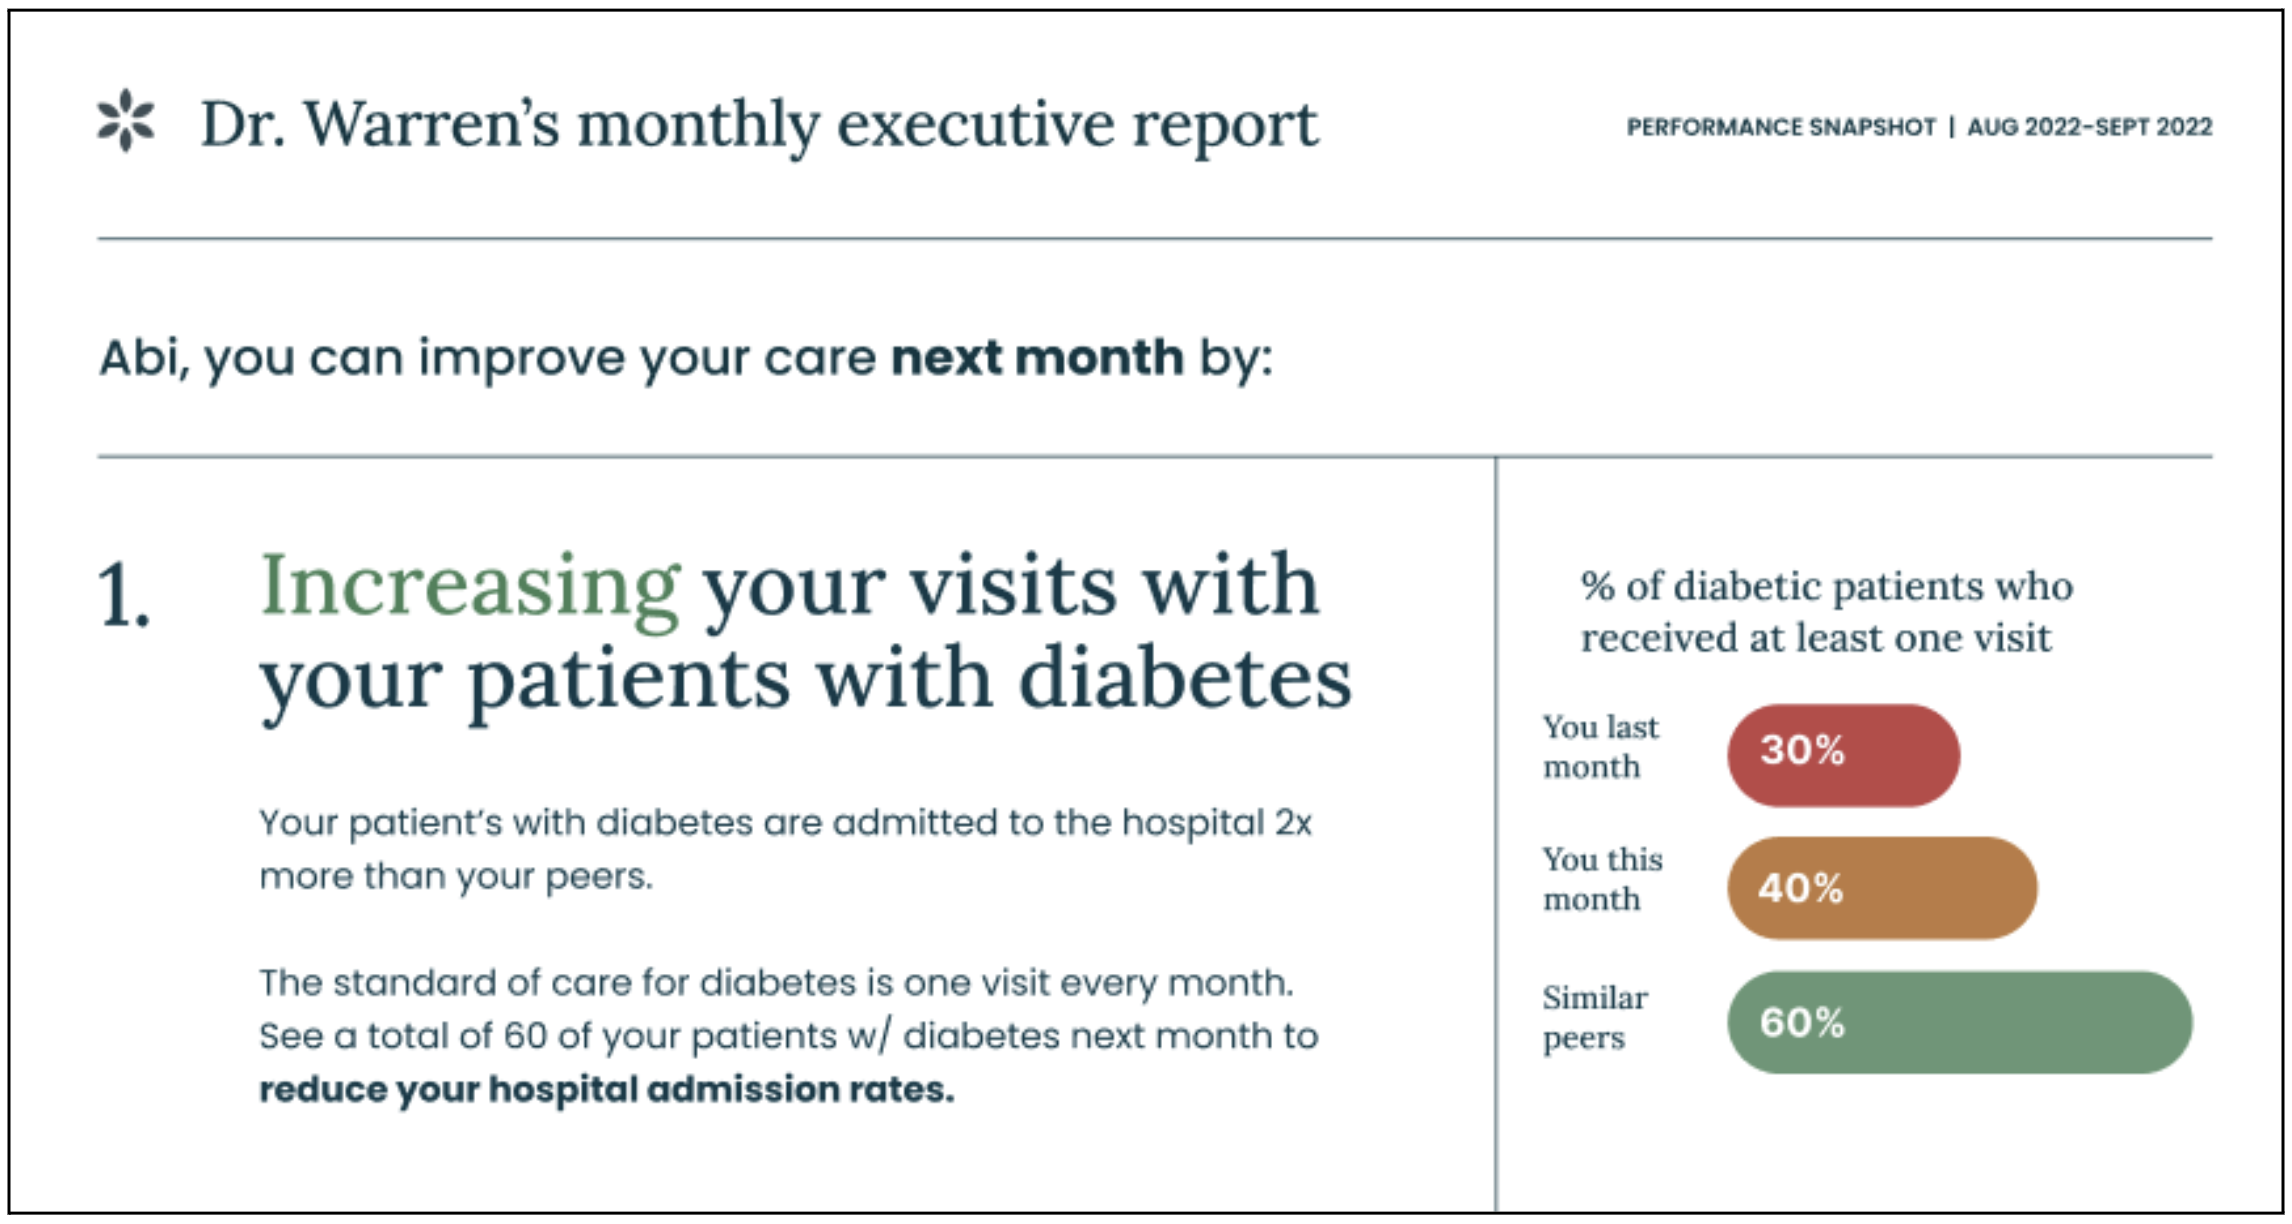
To leverage this insight, we used social comparison throughout the reports. For example, in addition to showing how much physicians spent on their practice each month, we included information on how their spending or performance compared to similar peers and the industry average. An important aspect of these social comparisons was ensuring that the comparable was as similar as possible to the provider. The more specific we could get with the practice region, patient population, etc., the more effective the comparison. We hypothesize that providing this relativity will motivate physicians to change their behavior.
Behavioral Science Approach #3: Actionable Insights
We wanted the report to move away from stating the obvious—and toward providing targeted and personalized guidance. To accomplish this, we paired every shared data point with a short one-sentence description of how the physician could improve their performance. For instance, after reporting on the number of diabetic visits in a given month, we shared tips on the number of additional patients the physician needed to see to reduce hospitalizations. Instead of simply saying ‘see more,’ we were precise and actionable in our recommendations—thus encouraging physicians to take meaningful steps toward improvement.
By incorporating these behavioral science insights into the redesigned reports, we aimed to positively impact physician behavior, improving both care and outcomes for patients.
From Overload to Impact: Zooming Out on Physician Data Summary Reports
The new physician data summary report—(re)designed in partnership with Belong —differs meaningfully from the industry standard. It is more digestible and actionable in both appearance and content, thus reducing cognitive overload and laying a foundation for physician behavior change.
Our collaboration with Belong convinced us that simply offering physicians more information does not change their behavior. Not only are even the smartest and highest-performing physicians subject to the same psychological biases as everyone else—the time scarcity and information overload that characterize the medical field deplete physicians’ cognitive resources. In the case of healthcare providers, less can be more—and simplified reports can change physician behavior for the better.
——————————–
Want to learn more about this work, or to partner with us to leverage behavioral science to solve your toughest healthcare problems? Contact us at [email protected].