
Companies are getting better and better at experimentation. They might not publish peer-reviewed papers, but they do take advantage of their access to thousands (or sometimes millions) of customers, as well as technology that enables trying lots of new things. Today, the most innovative businesses (Intuit, P&G, Google, Amazon, Netflix) have publicly stated they run thousands of experiments (Clarke, 2016). While this pace may only be achievable by the most sophisticated companies, experimentation platforms like Optimizely and Amplitude unlock off-the-shelf AB testing capabilities for small-to-medium sized companies. The end result is a high-speed learning model and a hard-to-ignore source of insights on human behavior and motivation.
As a behavioral science consulting firm that has worked with hundreds of companies from a broad array of industries, we see an opportunity for academics to pay attention to the insights this model has to offer. This article will pull from direct work experience and interviews with clients and partners. Our team has run over 50 experiments with companies across industries, including Facebook, Lilly, Aetna, Lyft, Kiva, AARP, as well as many smaller startups.
First, we’ll focus on companies’ growing appreciation for academic insights and how they are currently being used. Second, we’ll highlight the under-explored opportunity — what insights academics can glean from the sheer volume of experiments that is happening at companies.
Application of Academic Insights by Companies
There are three insights that we think companies are particularly well-versed in. 1) They notice a difference between stated and revealed preferences; 2) Choice architecture matters; 3) People are influenced by social proof and norms.
1. There Is a Difference Between Stated and Revealed Preferences: Customers Don’t Always Do What They Say They Will
Companies, for the most part, still rely on interviews, focus groups, and surveys to inform new feature development. However, with the growing ability to capture product usage and analyze data, companies are discovering that there is a difference between stated and revealed preferences (Samuelson, 1948). Customers might say they prefer one thing, but end up choosing something else.
The launch of Facebook’s News Feed offers an example. Before this feature launched, Facebook users had to click on friends’ profiles to see their updates. The News Feed pushed people’s updates into a feed, enabling users to see all their friends’ updates at once. Immediately after it launched, Facebook users were generally furious. One man, Ben Parr, even created a group called “Students Against Facebook News Feed” that gained 700,000 members within a number of days (Stephens-Davidowitz, 2017).
In this case, we might think a company would backtrack. Yet, Facebook did not do so: “Zuckerberg in fact knew that people liked the News Feed, no matter what they were saying in the groups. He had the data to prove it. People were spending more time on Facebook… And they were doing more there — dramatically more” (Kirkpatrick, 2010).
A second example of a gap between stated and revealed preferences is from Thumbtack, an online marketplace that connects and aggregates service providers like handymen and painters with people in need of their services. During onboarding, Thumbtack will ask service providers about their skillset, experience, types of jobs they may want, and how much they might charge for their services. The images below show which preferences Thumbtack might ask a handyman.
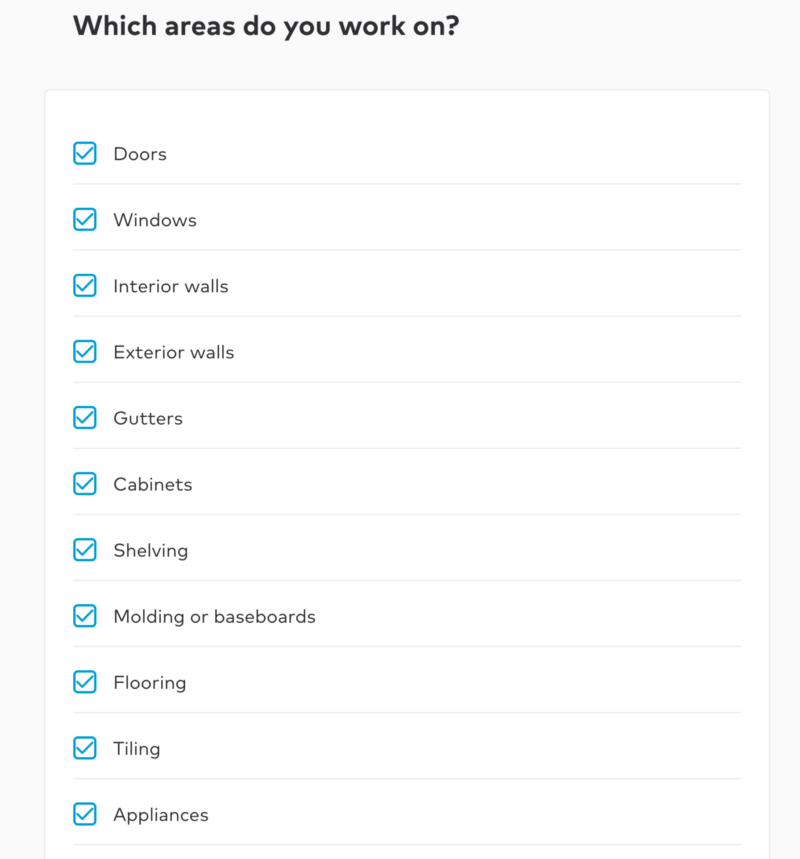
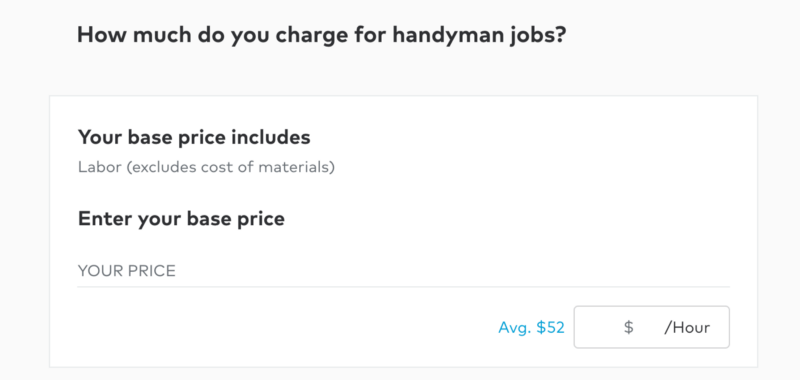
Thumbtack has observed a significant difference between what jobs service-providers say they are willing to do, and what jobs they actually take. “Their revealed preferences are, on average, substantially broader than their stated preferences when it comes to finding new projects to complete,” shares Lucas Puente, Lead Economist at Thumbtack. When Thumbtack offers them jobs outside the realms of their stated preferences (perhaps involving a different type of property or task than they originally selected) or price points, but match their location and skillset, many still take the work on.
2. Choice Architecture, or How Options Are Presented, Matters
Companies have a growing appreciation that the way choices are presented to consumers, termed choice architecture, has a strong impact on consumers’ decision-making. Many companies have internalized basic behavioral science wisdom that layout, range, and sequencing of options have an effect on what people ultimately choose (Johnson et al., 2012; Balz, Sunstein, & Thaler, 2014).
OKPanda, an English-language learning app, discovered the power of using choice architecture within their sign-up flow. Adam Gries, founder, explains that when the students first sign-up, they need to select what type of teacher they prefer. The main decision is between a native- speaking English teacher and a non-native English-speaking teacher. Through experimentation, OKPanda learned it was more effective, from a conversion standpoint, to have people answer a multiple-choice question upfront about their preferences than to present a list of teachers with key attributes listed on their profile (e.g., native or non-native).
Thumbtack has also experienced the power of choice architecture. They have found consumers are more likely to select the professional that first appears on the app who seems to meet their needs, particularly in certain categories where “done” is more important than “perfect.” In other words, Thumbtack noticed a lot of users were “satisficing,” a decision-making strategy where people select the alternative that is “good enough,” rather than putting in effort to find the best possible choice (Simon, 1978).
3. People Are Influenced by Social Proof and Norms
The use of social proof by companies is widespread (Das et al., 2014; Alcott & Rogers, 2014; Amblee & Bui, 2010). Perhaps the best-known example of leveraging social norms to drive behavior change has been conducted by Opower. They demonstrated that presenting social norm messaging about how much energy people’s neighbors were saving can be scaled to influence energy conservation across an entire community (Alcott, 2011; Zaval & Cornwell, 2016).
Information on what peers are doing can be especially enticing. Thumbtack shared that some of their most effective marketing campaigns revolved around the message of “what your neighbors are getting done on Thumbtack.” Additionally, one of the authors, Kristen, ran an experiment with Arizona Federal Credit Union that used social proof to help reduce spending on eating out (Common Cents, 2018). An email was sent to people in the experiment with a subject line that asked: “Curious how your spending on eating out compares to others?” This email had a click through rate that was 2.4 times higher than previous emails sent by the credit union.
Lessons from Companies
Based on our work with hundreds of companies, three main ideas stand out as a good start for the field of social science to learn from companies:
- There are more nuanced ways to think about friction,
- There are ways to build intuition faster, even within an academic context, and
- There may be benefits from research lacking generalizability.
1. Friction Is Complex — It Can Be Bad and Good
Behavioral science has shown that people can be deterred from taking action by even minor amounts of choice, added steps, time, effort, and decision-making. These types of behavioral “frictions” (perceived or real) generally decrease the probability that a given behavior takes place, and also account for a number of human biases (e.g., Murray & Haubl, 2007). For example, our propensity to stick with the status quo (Samuelson & Zeckhauser, 1988; Kahneman, Knetsch, & Thaler, 1991) and with defaults (Johnson & Goldstein, 2003), or avoid making difficult choices (Chernev, Böckenholt, & Goodman, 2016), are all examples of the power of friction. Designing for low friction is generally understood and accepted in companies. Evan Willams, founder of Twitter, has said that the key to making a fortune online is to remove extra steps from common activities (Wired, 2013).
The general approach of making designs simple and usable is accepted in industry, and focuses on the reduction of friction. However, there is an emerging understanding that some types of friction actually make designs more usable, not less.
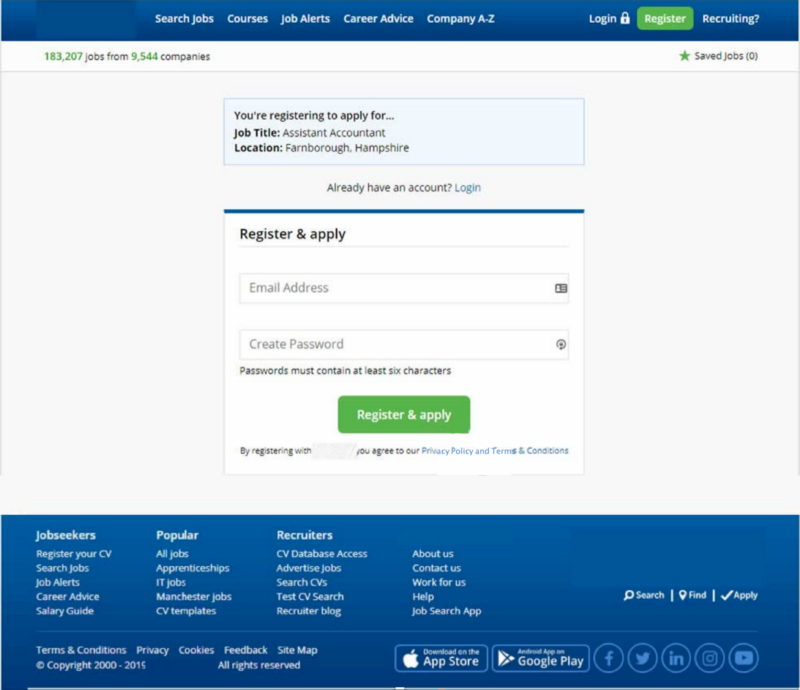
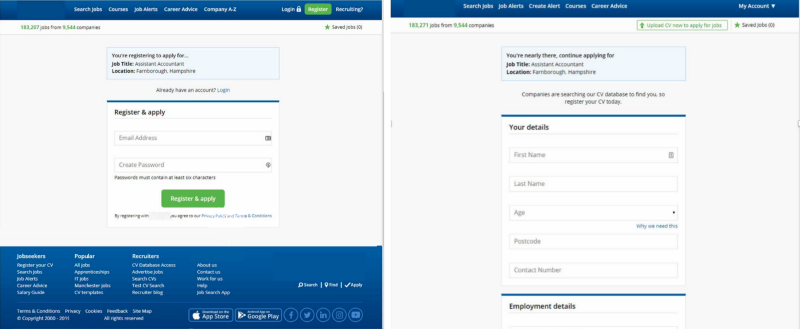
The first way friction within a system can be helpful is that it helps change the cost-benefit equation by decreasing the perception of future costs. One example comes from Ethan Smith, Growth Advisor at MasterClass, an online learning platform. Like many other products, MasterClass originally asked users for their email and credit card on a single screen (see Figure 3).
MasterClass then tested separating the email field and credit card fields onto two different screens, which is in direct contrast to design ‘best practices’ that recommend fewer steps is better due to the extra click required (see Figures 4 & 5).
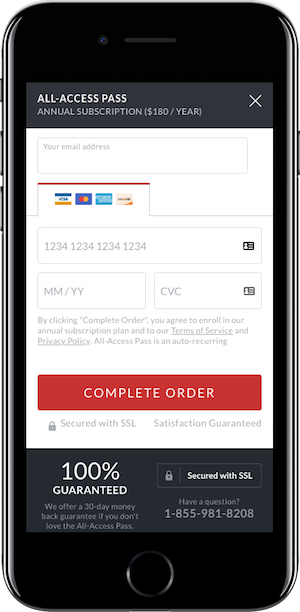
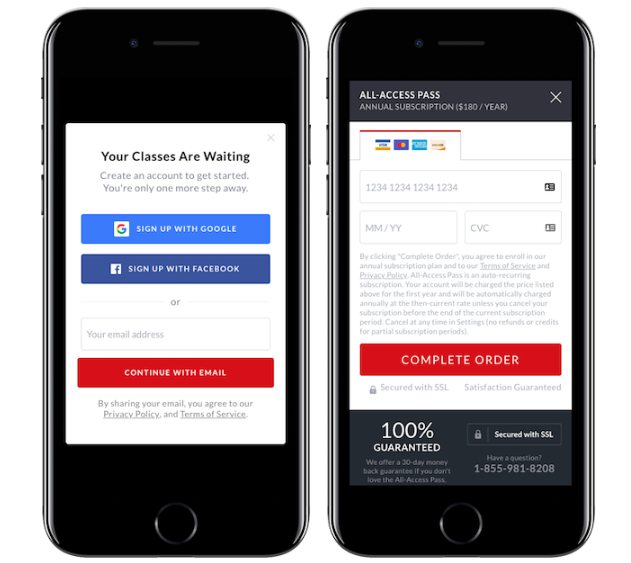
What MasterClass found, however, was a substantial increase in subscriptions, which is potentially attributable to the idea that even though the number of steps increased, the perceived level of “ask” on each step was reduced.
Goodui.org has reported similar results. Goodui.org is a platform that aggregates experimental results across different contexts, providing members with insights into effective design techniques. They report on a two-condition experiment. One condition has all the sign-up fields on one page, and the second condition breaks up the fields onto two pages.
Like MasterClass, the number of steps increased, but the amount of information collected stayed the same. And like MasterClass, doing this increased conversion (8.7% to 11.7%). Goodui.org includes this example in a series of five tests that all examine the effect of splitting up steps into multiple screens. Based on these five tests, they conclude that splitting up steps is a winning strategy that will likely increase conversion, with a 5.5% median effect.
A third example comes from Trunk Club, a clothing subscription service. To increase the number of site visitors that sign up for its service, Trunk Club tested a change to its sign-up flow. The new flow added more steps but allowed the user to focus on each question individually, with visuals supporting each question. Launching this experiment was a risk; the longer flow increased the number of opportunities a user had to drop out of the experience. However, the experiment results showed that the longer flow increased conversion by 133% (The Big Book of Experimentation, Optimizely).
In these examples, people became more motivated to continue when there were more, not fewer, steps. Ethan Smith explains:
Contrary to ‘best practices,’ adding more steps to a flow often does not reduce conversion. In fact, it can increase conversion. Users tend to focus on the current screen and the immediate decision of whether to continue or exit. They perform cost benefit analyses for each step. By reducing steps on each individual screen and separating them into more screens with fewer steps, the user perceives a reduced cost on each screen. This seemingly small change in the cost benefit equation can lead to dramatic increases in conversion.
It might be the case that there is a difference between actual friction and perceived friction. Breaking fields up into multiple steps does not allow people to fully consider all of the future costs in their decision making. They evaluate only one cost at a time.
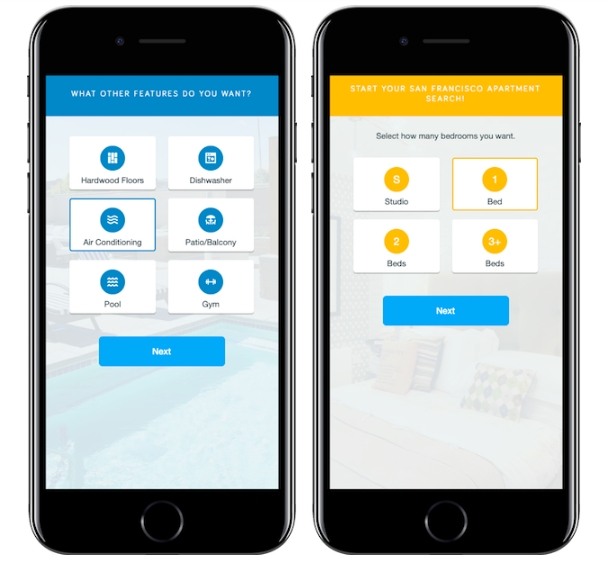
Another type of “good” friction that increases conversion is friction that builds a customer’s mental model of the product, and thus increases their intention to convert. Smith shares an example from Apartment List, an online apartment rental marketplace.
Apartment List increased conversion by adding relevant and easy to complete steps in their sign up flow (e.g., asking a user looking for an apartment how many bedrooms they need, their price range, and which features they want). While these additional questions increased friction for the user, these questions show the customer the potential benefits they will receive if they complete the flow. This change in the perceived benefit changes the cost benefit equation resulting in dramatically more users finding their new home.
This approach is currently being used at other companies. StitchFix is a subscription personal styling service. Given StitchFix’s relative newness to the market, it may be unclear how the service works and what benefits it can offer potential customers. To mitigate this, StitchFix asks questions in its sign-up flow that clarify the benefits the service can provide. For example, as shown below, they cleverly highlight multiple benefits by asking “What are the reasons you’re excited to try Stitch Fix?”
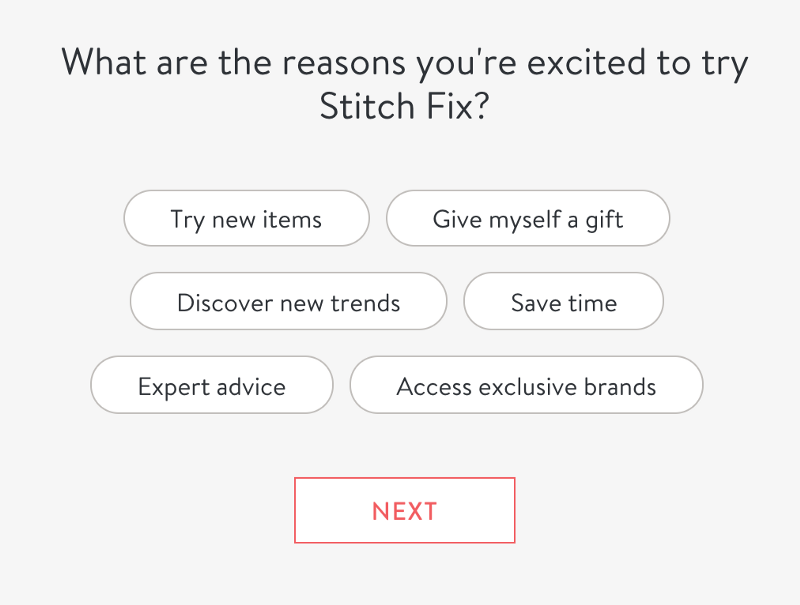
StitchFix also asks users if they want help with outfits for work, casual, or date nights. Without this question, users may assume Stitch Fix only handles one type of wardrobe — i.e., the business dress.
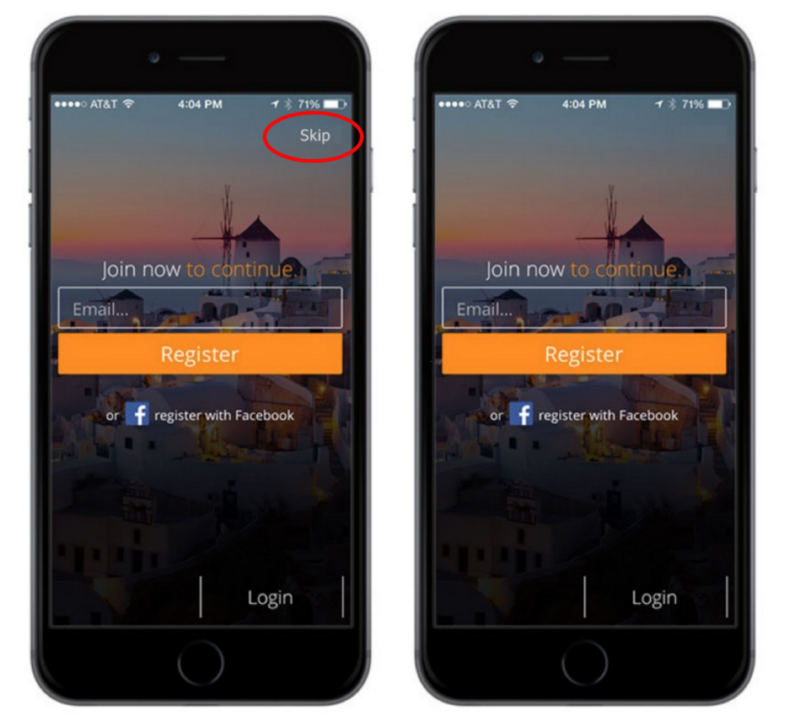
And finally, sometimes, friction might intrinsically be helpful. By slowing users down, it can increase general commitment and help them make better decisions. One example comes from Secret Escapes, a flash-sale travel company that offers discounted rates on 4–5 star hotels. Before launching their app, their internal team was conflicted about whether to allow users to see the travel deals without signing up (inputting their email and password). To test this, they ran an experiment. In the first condition, users were able to close or skip the sign-up screen. In the second condition, sign-up was required and no skip option was offered. The second condition, that forced users to sign-up, was the winning condition. It doubled the sign-up rate without negatively impacting reviews (see Figures 12 & 13) (The Big Book of Experimentation, Optimizely).
OKPanda observed a similar finding. People completed more language learning sessions when they were required to put down a credit card to activate the one-month free trial than those who were not asked to put down a credit card to activate it. Founder Adam Gries believes this was due to helping people actively commit to trying out the product. People who experienced no friction never fully committed to their free month.
Friction is complex. While most of the time, friction might prevent certain behaviors, companies are telling a more nuanced story. In this case, we show that some companies have found friction may be “good” if it serves to 1) decrease the perception of costs 2) increase attention to future benefits or 3) increase the likelihood of commitment. More research is needed to validate these hypotheses.
2. Build Intuition Faster
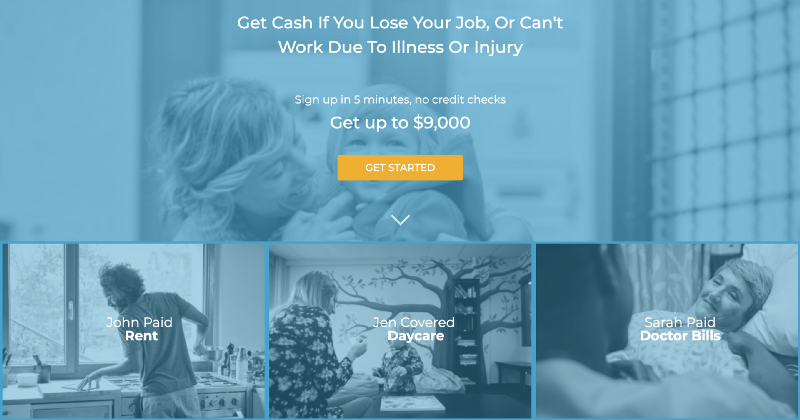
Our experience is that shortening the cycle for intuition-building is one of the most useful parts of companies’ execution speed. One of our clients, CUNA Mutual Group, asked us to help them with their unemployment insurance product, SafetyNet, which pays out up to $9,000 if the insured individual becomes unemployed. Building on the research that adding context to statistics helps people digest them (Barrio, Goldstein, & Hofman, 2016) we suggested the team translate the payout of $9,000 into something that a consumer could more easily relate to.
Within just a few days, CUNA Mutual Group launched an experiment. Some customers saw the original page, and some customers saw a new page with three added statements, “John paid rent,” “Jen covered daycare,” and “Sara paid medical bills” underneath the main benefit of the $9,000 payout. Within days, they had enough traffic to see that the new version had increased page-over-page conversion by 3%. With this data, they worked with their Marketing Department to implement the changes more formally with improved images and an integrated design.
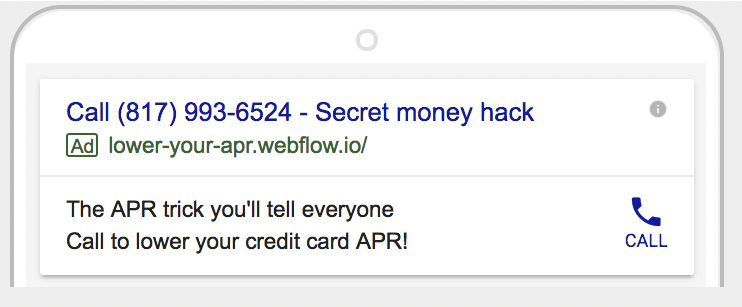
In addition to quickly running tests on their own websites, companies also often run tests using Facebook or Google ads. This strategy is often even faster, requiring less internal coordination and fewer approvals. Duke University’s Common Cents Lab implemented such a test that informed a partnership with Lendstreet. With the goal of reducing consumer debt, the team wanted to understand the most effective ways to get consumers to call their credit card companies and ask for lower interest rates. The team launched a 7-condition experiment on Google AdWords with different messaging, and then measured the call rates for each message.
Academics run pre-tests, but they are often confined to student samples or MTurk studies. When moving from lab testing to field experimentation, there might be risks. To mitigate these risks, companies have realized it is worth the investment to develop clever ways to conduct low-cost, low-risk pre-tests in the field.
3. What We Can Learn from a Lack of Generalizability
In academia, it’s important to develop interventions that are able to generalize across a population. Generalizability is a measure of how useful the results of a study are for a broader group of people or situations; lack of generalizability is therefore often an evil to be avoided. Lack of generalizability can arise if the participant pool is limited to certain narrow characteristics (e.g., small age range, narrow income band, specific location). Interestingly, companies don’t appear to care about this. Imagine that a company launches a feature that it hopes will help all of their customers. Instead, a smaller subset of users actually opt in to use the feature. In this case, the company does not care about the intent-to-treat effect or to understand if the feature might have a similar effect on customers that do not opt in.
Instead, they analyze data to see if the feature increased their business metrics for the subset of customers that did opt in, compared to customers that did not. They are effectively ignoring selection bias — these two groups (people who opt in and people who don’t opt in) may be completely different types of people. Yet, if the new feature improves business outcomes for this small subset, the company might put more effort into designing interventions for that subset in hopes they can convince more customers to opt in.
For example, a popular SaaS company completed an analysis of which users were likely to continue past the free trial period. They found that users were more likely to stay beyond the trial period if they had added another user, such as a colleague, to the service within the first week. The team then put significant effort into ensuring that all new users were nudged to add a colleague within the first week. As another example, Facebook employees have shared that in Facebook’s early days, if a new user added 7 friends in ten days to Facebook, they were likely to be a user for life. Based on this correlation, the team designed a sign-up flow to get people to add 7 friends.
What appears to be happening is not a confusion on causality and correlation (although in some companies it might be), but rather a strategic decision. They have found it is easier to focus on learning from their best users, even if is a self-selected sample, than exerting effort to create a representative user sample that would generalize better.
Adam Gries of OKPanda shares that he, too, started with an initial strategy of “going after everybody.” However, when the team looked at their user data, they found that only users who demonstrated interest in creating a “language learning plan” ended up being the most successful. The team, seeing this data, focused on getting more good users — the “plan-creating users” — and let go of trying to convert the super-casual users that had no interest in creating a plan.
Moreover, while this strategy will never allow practitioners to conclude the causal direction of an effect (for example, perhaps most successful users are the ones who would want to create a language learning plan), it does help practitioners narrow in on their most engaged customers.
We recommend that academics internalize this type of thinking for some research projects. At times it may be okay (and even desirable) to have behavioral insights that do not generalize to everyone. Focusing research on the subset of people for whom intervention would be most useful can be an easier and a potentially more impactful strategy.
Conclusion
Much has already been written about the rise of behavioral science and the demand from companies to apply academic insights to improve business outcomes. Indeed, last year’s Behavioral Economics Guide opened with an introduction from Robert Cialdini on the golden age of behavioral science. Cialdini, supporting this notion of bi-directional influence, suggested that this “love affair” between businesses and academics would develop into a “comfortable interdependence” moving forward.
And it is happening. Companies are increasingly looking to the social science world for insights on human behavior, in hopes they can build better products. Companies are also experimenting. They are learning what drives their customers’ behavior. Often, the insights they discover are old news to the social science community. But sometimes, companies are on the edge of new and interesting insights that could lead to a greater understanding of human behavior. This can only be good for a more symbiotic relationship to develop.
Full citations can be found in the 2019 Behavioral Economics guide.
Learn more about Irrational Labs’ Behavioral Economics Bootcamp.